Access the Timeseries Data
GIVE ME DATA
You might be saying “Okay, that’s a lot of code and links Micah, but I just wanted the data”
Well have I got a notebook for you!
The whole point of wading through this layer of code, is that now you don’t have to worry about how the underlying APIs work, you can just ask for the data
[1]:
# we need imports
from datetime import datetime
import pandas as pd

from metloom.pointdata import SnotelPointData, CDECPointData
[2]:
# Let's look at our old friend banner summit
pt = SnotelPointData("312:ID:SNTL", "Banner Summit")

# start data and end date
start_date = datetime(2017, 3, 1)
end_date = datetime(2017, 4, 1)
# Notice this is a list
variables = [pt.ALLOWED_VARIABLES.SWE]

# request the data
df = pt.get_daily_data(start_date, end_date, variables)
df.head(10)
[2]:
| geometry | SWE | SWE_units | datasource | ||
|---|---|---|---|---|---|
| datetime | site | ||||
| 2017-03-01 08:00:00+00:00 | 312:ID:SNTL | POINT Z (-115.23447 44.30342 7040) | 31.9 | in | NRCS |
| 2017-03-02 08:00:00+00:00 | 312:ID:SNTL | POINT Z (-115.23447 44.30342 7040) | 32.0 | in | NRCS |
| 2017-03-03 08:00:00+00:00 | 312:ID:SNTL | POINT Z (-115.23447 44.30342 7040) | 32.1 | in | NRCS |
| 2017-03-04 08:00:00+00:00 | 312:ID:SNTL | POINT Z (-115.23447 44.30342 7040) | 32.4 | in | NRCS |
| 2017-03-05 08:00:00+00:00 | 312:ID:SNTL | POINT Z (-115.23447 44.30342 7040) | 33.3 | in | NRCS |
| 2017-03-06 08:00:00+00:00 | 312:ID:SNTL | POINT Z (-115.23447 44.30342 7040) | 33.6 | in | NRCS |
| 2017-03-07 08:00:00+00:00 | 312:ID:SNTL | POINT Z (-115.23447 44.30342 7040) | 33.9 | in | NRCS |
| 2017-03-08 08:00:00+00:00 | 312:ID:SNTL | POINT Z (-115.23447 44.30342 7040) | 34.5 | in | NRCS |
| 2017-03-09 08:00:00+00:00 | 312:ID:SNTL | POINT Z (-115.23447 44.30342 7040) | 35.2 | in | NRCS |
| 2017-03-10 08:00:00+00:00 | 312:ID:SNTL | POINT Z (-115.23447 44.30342 7040) | 36.2 | in | NRCS |
[3]:
## Let's look at the data
df.reset_index().set_index("datetime")["SWE"].plot()
[3]:
<Axes: xlabel='datetime'>
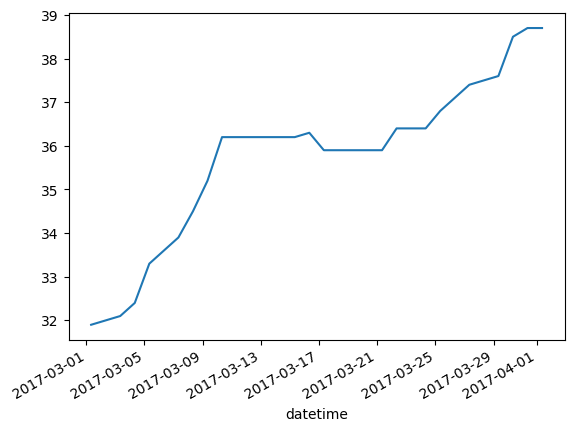
Wait what just happened with that index thing?
The get_<>_data methods return a pandas dataframe with a multi-level index on datetime and site This makes it easy to merge data from multiple stations together, but it is important to remember when plotting and exporting
[4]:
print(df.index.levels[0])
print(df.index.levels[1])
DatetimeIndex(['2017-03-01 08:00:00+00:00', '2017-03-02 08:00:00+00:00',
               '2017-03-03 08:00:00+00:00', '2017-03-04 08:00:00+00:00',
               '2017-03-05 08:00:00+00:00', '2017-03-06 08:00:00+00:00',
               '2017-03-07 08:00:00+00:00', '2017-03-08 08:00:00+00:00',
               '2017-03-09 08:00:00+00:00', '2017-03-10 08:00:00+00:00',
               '2017-03-11 08:00:00+00:00', '2017-03-12 08:00:00+00:00',
               '2017-03-13 08:00:00+00:00', '2017-03-14 08:00:00+00:00',
               '2017-03-15 08:00:00+00:00', '2017-03-16 08:00:00+00:00',
               '2017-03-17 08:00:00+00:00', '2017-03-18 08:00:00+00:00',
               '2017-03-19 08:00:00+00:00', '2017-03-20 08:00:00+00:00',
               '2017-03-21 08:00:00+00:00', '2017-03-22 08:00:00+00:00',
               '2017-03-23 08:00:00+00:00', '2017-03-24 08:00:00+00:00',
               '2017-03-25 08:00:00+00:00', '2017-03-26 08:00:00+00:00',
               '2017-03-27 08:00:00+00:00', '2017-03-28 08:00:00+00:00',
               '2017-03-29 08:00:00+00:00', '2017-03-30 08:00:00+00:00',
               '2017-03-31 08:00:00+00:00', '2017-04-01 08:00:00+00:00'],
              dtype='datetime64[ns, UTC]', name='datetime', freq=None)
Index(['312:ID:SNTL'], dtype='object', name='site')
Comprehension check
What if I wanted to get accumulated precip and SWE from the same station in one request?
[5]:
# Your code here
df_multiple = None
[6]:
# Merge two dataframes

# Get data for mammoth pass using CDEC
mhp = CDECPointData("MHP", "Mammoth Pass")
variables = [mhp.ALLOWED_VARIABLES.SWE]
df2 = mhp.get_daily_data(start_date, end_date, variables)

# merge the data with the banner summit response
df_merged = pd.concat([df, df2])

# Notice 2 entries for each date, one for each station.
# Also notice times are slightly different because we converted
# From 2 timezones to UTC
df_merged.sort_index(level=0).head(10)
[6]:
| geometry | SWE | SWE_units | datasource | ||
|---|---|---|---|---|---|
| datetime | site | ||||
| 2017-03-01 08:00:00+00:00 | 312:ID:SNTL | POINT Z (-115.23447 44.30342 7040) | 31.90 | in | NRCS |
| MHP | POINT Z (-119.03175 37.6124 9300) | 62.16 | INCHES | CDEC | |
| 2017-03-02 08:00:00+00:00 | 312:ID:SNTL | POINT Z (-115.23447 44.30342 7040) | 32.00 | in | NRCS |
| MHP | POINT Z (-119.03175 37.6124 9300) | 62.16 | INCHES | CDEC | |
| 2017-03-03 08:00:00+00:00 | 312:ID:SNTL | POINT Z (-115.23447 44.30342 7040) | 32.10 | in | NRCS |
| MHP | POINT Z (-119.03175 37.6124 9300) | 62.16 | INCHES | CDEC | |
| 2017-03-04 08:00:00+00:00 | 312:ID:SNTL | POINT Z (-115.23447 44.30342 7040) | 32.40 | in | NRCS |
| MHP | POINT Z (-119.03175 37.6124 9300) | 62.16 | INCHES | CDEC | |
| 2017-03-05 08:00:00+00:00 | 312:ID:SNTL | POINT Z (-115.23447 44.30342 7040) | 33.30 | in | NRCS |
| MHP | POINT Z (-119.03175 37.6124 9300) | 62.28 | INCHES | CDEC |
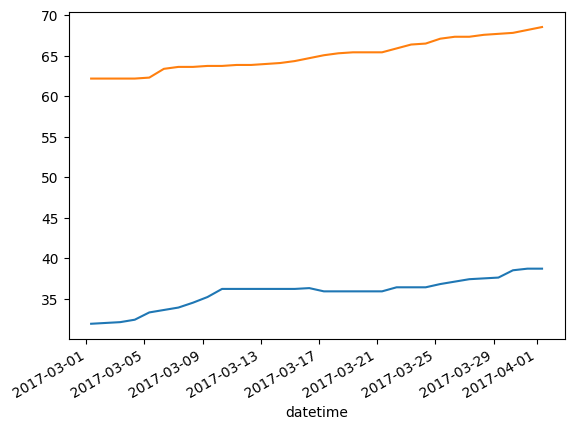
[7]:
# plot both
ax = df.reset_index().set_index("datetime")["SWE"].plot()
df2.reset_index().set_index("datetime")["SWE"].plot(ax=ax)
[7]:
<Axes: xlabel='datetime'>
In the next section, we will explore how you can find the points you’re interested in