Downloading CDEC Snow Depth Data
Created by Hannah Besso, July 2023
This notebook does the following:
Load a region of interest
Make a geodataframe of the coordinates of all CDEC stations within the roi
Make a dataframe of snow depth data from a single CDEC station
Make a dataframe containing snow depth data from all CDEC stations within the roi
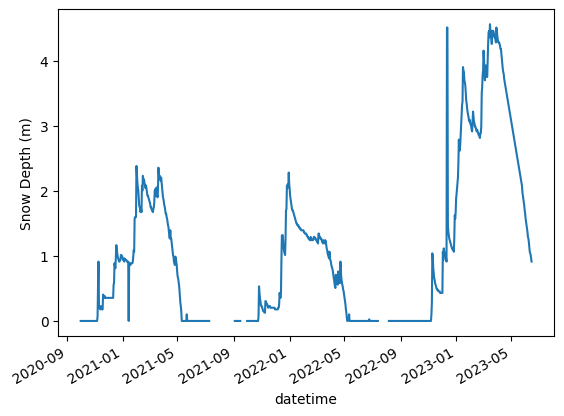
Convert from inches to meters and plot the timeseries of one station
Import necessary packages
[1]:
import numpy as np
import geopandas as gpd
import pandas as pd
import matplotlib.pyplot as plt
from datetime import datetime
from shapely.geometry import Point
import metloom
from metloom.pointdata import CDECPointData
from metloom.variables import CdecStationVariables
Load USA states:
[2]:
states_url = 'http://eric.clst.org/assets/wiki/uploads/Stuff/gz_2010_us_040_00_5m.json'
states_gdf = gpd.read_file(states_url)
california = states_gdf.loc[states_gdf.NAME == 'California']
[3]:
from shapely.geometry import Polygon

coords = [(-120.03380085114448,38.2593960348446),
          (-120.03380085114448,36.934834847980355),
          (-118.1903872978364,36.934834847980355),
          (-118.1903872978364,38.2593960348446),
          (-120.03380085114448,38.2593960348446)]

polygon = Polygon(coords)

central_sierra = gpd.GeoDataFrame(index=[0], crs='epsg:4326', geometry=[polygon])
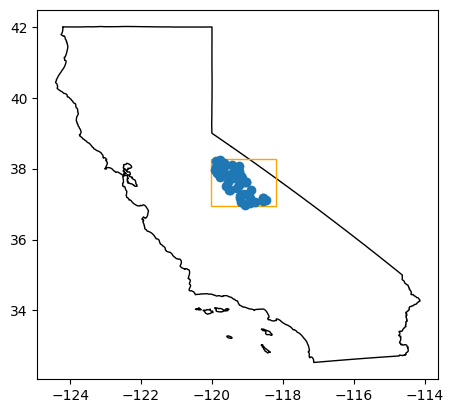
Access a geodataframe of CDEC station locations:
Using the California polygon to get a list of all stations, excluding snow courses
[4]:
vrs = [
#    CdecStationVariables.SWE      # I want snow depth but SWE is also available
    CdecStationVariables.SNOWDEPTH
]
points = CDECPointData.points_from_geometry(central_sierra, vrs, snow_courses=False)
cdec_locations = points.to_dataframe()
cdec_locations.set_crs('epsg:4326')
cdec_locations.head()
[4]:
| name | id | datasource | geometry | |
|---|---|---|---|---|
| 0 | HUNTINGTON LAKE (USBR) | HNT | CDEC | POINT Z (-119.22048 37.22757 7000) |
| 1 | WHITE WOLF | WHW | CDEC | POINT Z (-119.65161 37.85944 7900) |
| 2 | GIN FLAT | GIN | CDEC | POINT Z (-119.77491 37.76689 7050) |
| 3 | LOWER RELIEF VALLEY | REL | CDEC | POINT Z (-119.76292 38.24292 8100) |
| 4 | MARIPOSA GROVE | MPG | CDEC | POINT Z (-119.6 37.5 6400) |
[5]:
fig, ax = plt.subplots()

california.plot(facecolor='none', edgecolor='k', ax=ax)
central_sierra.plot(facecolor='none', edgecolor='orange', ax=ax)
cdec_locations.plot(ax=ax);
Download snow depth data for a single CDEC station:
[6]:
start_date = datetime(2020,10,1)
end_date = datetime(2023,7,31)
[7]:
# Download data for TUM to get the datetime index:
cdec_point = CDECPointData("TUM", "TUM")
tum_depth = cdec_point.get_daily_data(
    start_date, end_date,
    [cdec_point.ALLOWED_VARIABLES.SNOWDEPTH]
)
tum_depth.head()
[7]:
| geometry | SNOWDEPTH | SNOWDEPTH_units | datasource | ||
|---|---|---|---|---|---|
| datetime | site | ||||
| 2020-10-01 08:00:00+00:00 | TUM | POINT Z (-119.34997 37.87622 8500) | 0.0 | INCHES | CDEC |
| 2020-10-02 08:00:00+00:00 | TUM | POINT Z (-119.34997 37.87622 8500) | 0.0 | INCHES | CDEC |
| 2020-10-03 08:00:00+00:00 | TUM | POINT Z (-119.34997 37.87622 8500) | 0.0 | INCHES | CDEC |
| 2020-10-04 08:00:00+00:00 | TUM | POINT Z (-119.34997 37.87622 8500) | 1.0 | INCHES | CDEC |
| 2020-10-05 08:00:00+00:00 | TUM | POINT Z (-119.34997 37.87622 8500) | 0.0 | INCHES | CDEC |
Create a dataframe of snow depth data from every CDEC station within the ROI:
[8]:
# Reindex from a multiindex so I can easily access the datetime index:
tum_depth = tum_depth.reset_index()
tum_depth = tum_depth.set_index('datetime')

# Create a new empty dataframe with the TUM datetime index:
snwd_df = pd.DataFrame()
snwd_df.index = pd.DatetimeIndex(data=tum_depth.index)

# Iteratively download all the data and add the SNOWDEPTH column to the snwd_df:
# Note that the snow depth unit is inches
for i in range(len(cdec_locations)):
    cdec_point = CDECPointData(cdec_locations.id.values[i], cdec_locations.id.values[i])
    cdec_depth = cdec_point.get_daily_data(
        start_date, end_date,
        [cdec_point.ALLOWED_VARIABLES.SNOWDEPTH]
    )
    if cdec_depth is not None:
        cdec_depth = cdec_depth.reset_index()
        cdec_depth = cdec_depth.set_index('datetime')
        snwd_df[f'{cdec_locations.id.values[i]}'] = cdec_depth['SNOWDEPTH']
    else:
        continue
[9]:
snwd_df.head()
[9]:
| HNT | WHW | GIN | REL | MPG | GRV | MHP | KSP | AGP | GRM | ... | MLK | KUP | DPO | PDS | HRS | BCB | TMR | SLK | SLI | GEM | |
|---|---|---|---|---|---|---|---|---|---|---|---|---|---|---|---|---|---|---|---|---|---|
| datetime | |||||||||||||||||||||
| 2020-10-01 08:00:00+00:00 | 2.0 | 0.0 | 1.0 | 0.0 | 25.208333 | 1.0 | 1.0 | 0.0 | 0.0 | NaN | ... | 64.750000 | 0.0 | 1.0 | 4.0 | NaN | 0.0 | 2.0 | 10.0 | NaN | NaN |
| 2020-10-02 08:00:00+00:00 | 1.0 | 0.0 | 0.0 | 0.0 | 11.913043 | 1.0 | 0.0 | 1.0 | 0.0 | NaN | ... | 65.458333 | 0.0 | 1.0 | 4.0 | NaN | 0.0 | 2.0 | 14.0 | NaN | NaN |
| 2020-10-03 08:00:00+00:00 | 1.0 | 0.0 | 0.0 | 0.0 | 25.208333 | 1.0 | NaN | 1.0 | 0.0 | NaN | ... | 56.666667 | 0.0 | 1.0 | 1.0 | NaN | 0.0 | 2.0 | 14.0 | NaN | NaN |
| 2020-10-04 08:00:00+00:00 | 1.0 | 0.0 | 0.0 | 0.0 | 20.541667 | 1.0 | 0.0 | 1.0 | 0.0 | NaN | ... | 40.208333 | 0.0 | 1.0 | 4.0 | NaN | 0.0 | 2.0 | 13.0 | NaN | NaN |
| 2020-10-05 08:00:00+00:00 | 1.0 | 0.0 | 0.0 | 0.0 | 11.458333 | 1.0 | 0.0 | 1.0 | 0.0 | NaN | ... | 47.333333 | 0.0 | 1.0 | 3.0 | NaN | 0.0 | 2.0 | 12.0 | NaN | NaN |
5 rows × 41 columns
[10]:
# convert from inches to meters
snwd_df_m = snwd_df * 0.0254
[11]:
fig, ax = plt.subplots()

snwd_df_m['DAN'].plot(ax=ax)
ax.set_ylabel('Snow Depth (m)')
[11]:
Text(0, 0.5, 'Snow Depth (m)')
[ ]: